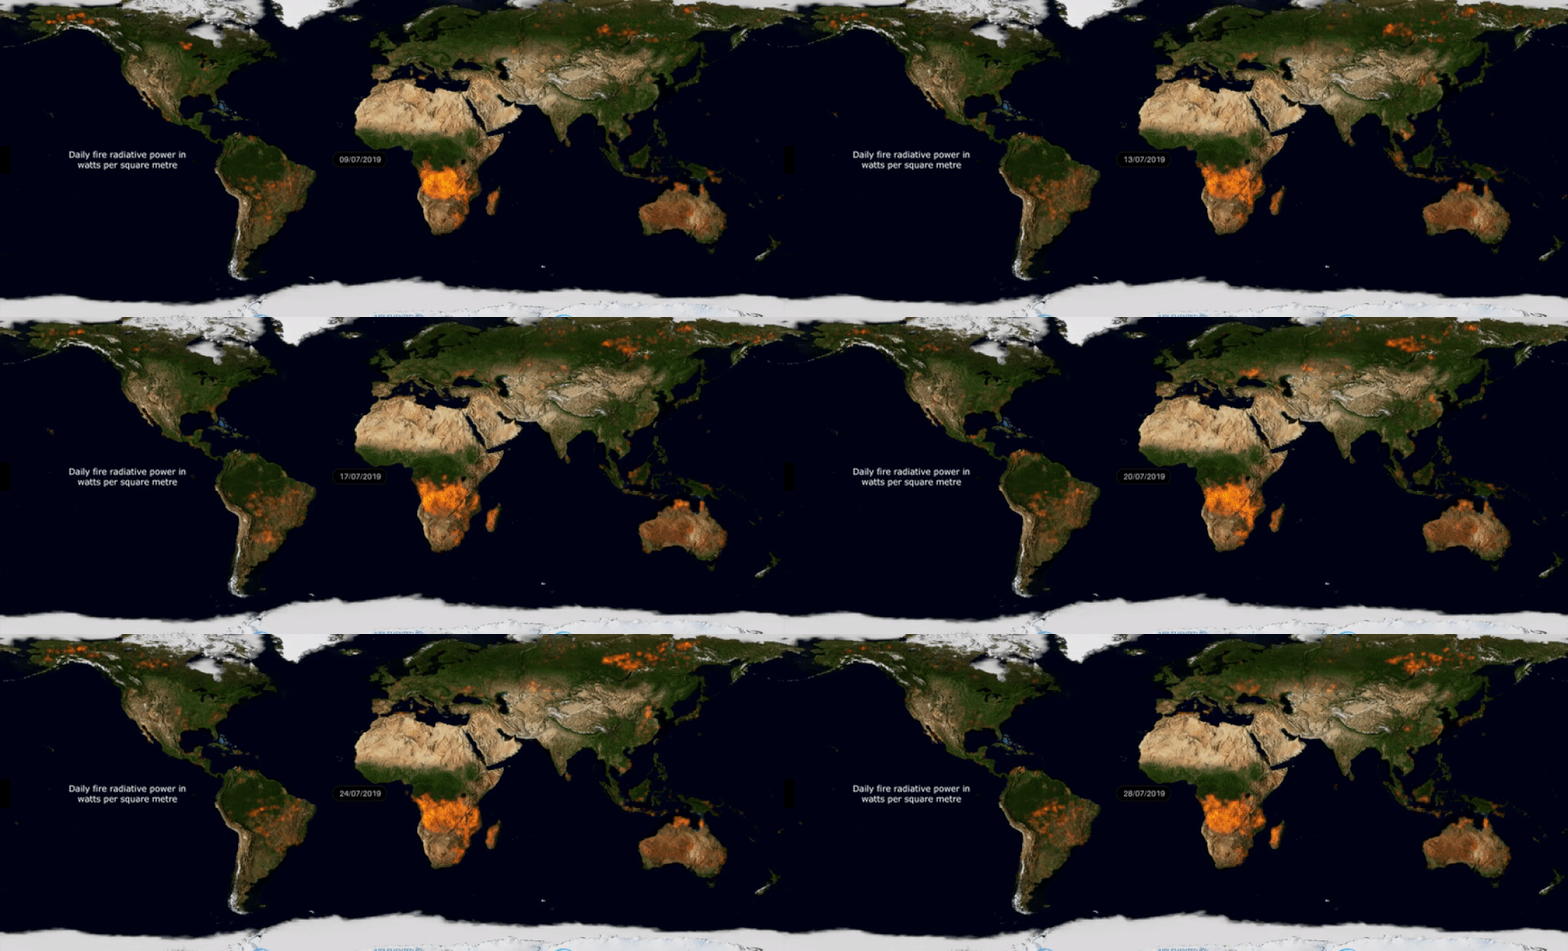
Sometimes you need to see the bigger picture to understand the scale of a problem. A new visualisation from the Copernicus programme in Europe has done exactly that, showing how wildfires have been worsening around the world.
Pulling together imagery and sensor readings from satellites, the 92-second clip shows our world on fire during 2019, mapping the areas of the planet that lit up with wildfires over the course of the last 12 months.
As the clip develops, the seriousness of the problem becomes clear: some parts of the world barely get a break from wildfire activity during 2019. Other regions light up, then go dark again as the seasons change.
The data were pulled together and made available through an initiative called the Copernicus Atmosphere Monitoring Service (CAMS). It's organised by the European Centre for Medium-Range Weather Forecasts, and is designed to help governments and companies plan for wildfires and the resulting pollution.
"It has been an extremely busy year for CAMS regarding the monitoring of wildfires," says CAMS senior scientist Mark Parrington. "Throughout the year we have been closely watching the intensity of the fires and the smoke they emit all around the world and have experienced at times some quite exceptional fire activity.
"Even in places where we would expect to see fires at certain points of the year some of the activity has been surprising."
Since the turn of the year we've seen devastating fires spreading across California, for example, leaving behind a trail of destruction that's visible from space.
Hundreds of buildings have been destroyed by ravaging flames in the state, with the Kincade wildfire in particular thought to be responsible for burning tens of thousands of acres of land.
We've seen wildfires in the Arctic too, a sign of warming conditions in the coldest parts of Earth. You can see these fires appear in the Copernicus video as winter turns to summer in the Northern Hemisphere.
More than 100 wildfires have been ignited in the Arctic circle during the course of 2019, burning carbon reserves that then contribute to further warming of the atmosphere – these wildfires release more greenhouse gases into the air, while at the same time reducing the number of trees and vegetation able to soak up carbon dioxide.
Add in the threat to people and property, and it's a worrying situation. We've recently seen air quality in Sydney, Australia hit 12 times the level deemed as hazardous, because of nearby fires releasing smoke and particles into the air.
Between the start of 2019 and the end of November, CAMS estimates that 6,375 megatons of CO2 has been pushed into the atmosphere by wildfires across the globe. Besides the fires we've mentioned, there were notable ones in Syria, Indonesia, and Alberta, Canada.
So much smoke was produced by the Alberta fires that it was carried all the way across the Atlantic Ocean to Europe, as tracked by the CAMS satellites.
However, in some areas – including Europe and Southern Tropical Africa – wildfire activity is actually down on what it was earlier in the 2000s.
It's a complex, ever-changing picture, but as the planet warms up and the climate shifts, producing more risky fire conditions, we can expect wildfires to increase in number, causing more damage to buildings and air quality. The 2020 video of wildfire activity might be even scarier yet.
"Although fire activity overall has been fairly average in the global sense for 2019, compared to previous years, there have been several instances of unusual intense activity in certain regions, including places with regular fire seasons, which has been devastating," says Parrington.
"fire" - Google News
December 16, 2019 at 08:18AM
https://ift.tt/35pEPOr
Staggering Video Shows How Much of Earth Was Actually on Fire in 2019 - ScienceAlert
"fire" - Google News
https://ift.tt/2rPfnCQ
Shoes Man Tutorial
Pos News Update
Meme Update
Korean Entertainment News
Japan News Update
Bagikan Berita Ini


0 Response to "Staggering Video Shows How Much of Earth Was Actually on Fire in 2019 - ScienceAlert"
Post a Comment